
Manual datasheet

27/12/y 08:46:20
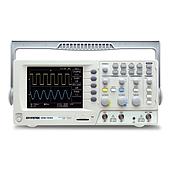
An oscilloscope plots a graph of an electrical signal. In most applications, the graph shows how the signal changes over time: The vertical (Y) axis represents voltage and the horizontal (X) axis represents time. The intensity or brightness of the display is sometimes called the Z-axis. This simple graph can tell us a lot about a signal.

ຕິດຕາມຂ່າວສານ ແລະ ຂໍ້ສະເໜີ
ຮັບສ່ວນຫຼຸດພິເສດຕາມປະລິມານ, ອັບເດດລາຄາຂາຍສົ່ງ ແລະ ການແຈ້ງເຕືອນສິນຄ້າໃໝ່ສົ່ງກົງເຖິງອິນບັອກຂອງທ່ານ.
ໂດຍການສະໝັກສະມາຊິກ, ທ່ານຍອມຮັບ ເງື່ອນໄຂການໃຫ້ບໍລິການ ແລະ ນະໂຍບາຍຄວາມເປັນສ່ວນຕົວ ຂອງພວກເຮົາ.
ການຊ່ວຍເຫຼືໍາດ່ວນ
ເຂົ້າເຖິງຜູ້ຊ່ຽວຊານທີ່ໄດ້ຮັບການຢັ້ງຢືນຂອງພວກເຮົາໂດຍກົງ